Trading analysis for the GBP/USD pair
The GBP/USD pair has started to experience successive upward movements in the last two days, as I observed through the daily timeframe. In the long term, the buyer's next price target is to penetrate the indigo zone or weak resistance which is at the level of 1.3581-1.3671. So far the area has not had a retest experience though.
Figure for the pair GBP/USD using the daily time frame.
 On the four-hour time frame, the seller still has not been able to penetrate the gray zone or weak support which is at the level of 1.2988-1.3014, after experiencing a rejection at 04.00 server time, March 15, 2022. The buyer's next price target is to be able to penetrated the pink zone or the untested resistance at the level of 1.3168-1.3207.
Figure for the pair GBP/USD using the four-hour time frame.
On the four-hour time frame, the seller still has not been able to penetrate the gray zone or weak support which is at the level of 1.2988-1.3014, after experiencing a rejection at 04.00 server time, March 15, 2022. The buyer's next price target is to be able to penetrated the pink zone or the untested resistance at the level of 1.3168-1.3207.
Figure for the pair GBP/USD using the four-hour time frame.
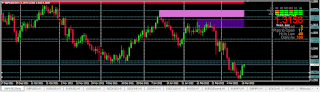
 Meanwhile, in the one hour time frame, efforts from the seller to penetrate the green zone or verified support at the levels of 1.3012-1.3067 are still being rejected at 20.00 server time, March 16, 2022.
The buyer's next price target is to be able to penetrate the red zone or verified resistance which is at the level of 1.3179-1.3198. if the price can penetrate it validly, it is estimated that the GBP/USD pair will rise even higher. However, if the business is still experiencing rejection, it will cause the price to move down again.
For today's trading plan, I will be waiting for how the price will react when trying to penetrate the verified resistance area. If the price can penetrate it validly, then I will place a buy order. The profit target will be at the level of 1.3418. the stop loss will be at the level of 1.3176.
Figure for the pair GBP/USD using the one hour time frame.
Meanwhile, in the one hour time frame, efforts from the seller to penetrate the green zone or verified support at the levels of 1.3012-1.3067 are still being rejected at 20.00 server time, March 16, 2022.
The buyer's next price target is to be able to penetrate the red zone or verified resistance which is at the level of 1.3179-1.3198. if the price can penetrate it validly, it is estimated that the GBP/USD pair will rise even higher. However, if the business is still experiencing rejection, it will cause the price to move down again.
For today's trading plan, I will be waiting for how the price will react when trying to penetrate the verified resistance area. If the price can penetrate it validly, then I will place a buy order. The profit target will be at the level of 1.3418. the stop loss will be at the level of 1.3176.
Figure for the pair GBP/USD using the one hour time frame.


Comments
Post a Comment